Customer Churn Radar
Data & Processes • Work sample
Live: churn.bastian-brand.com
What it is
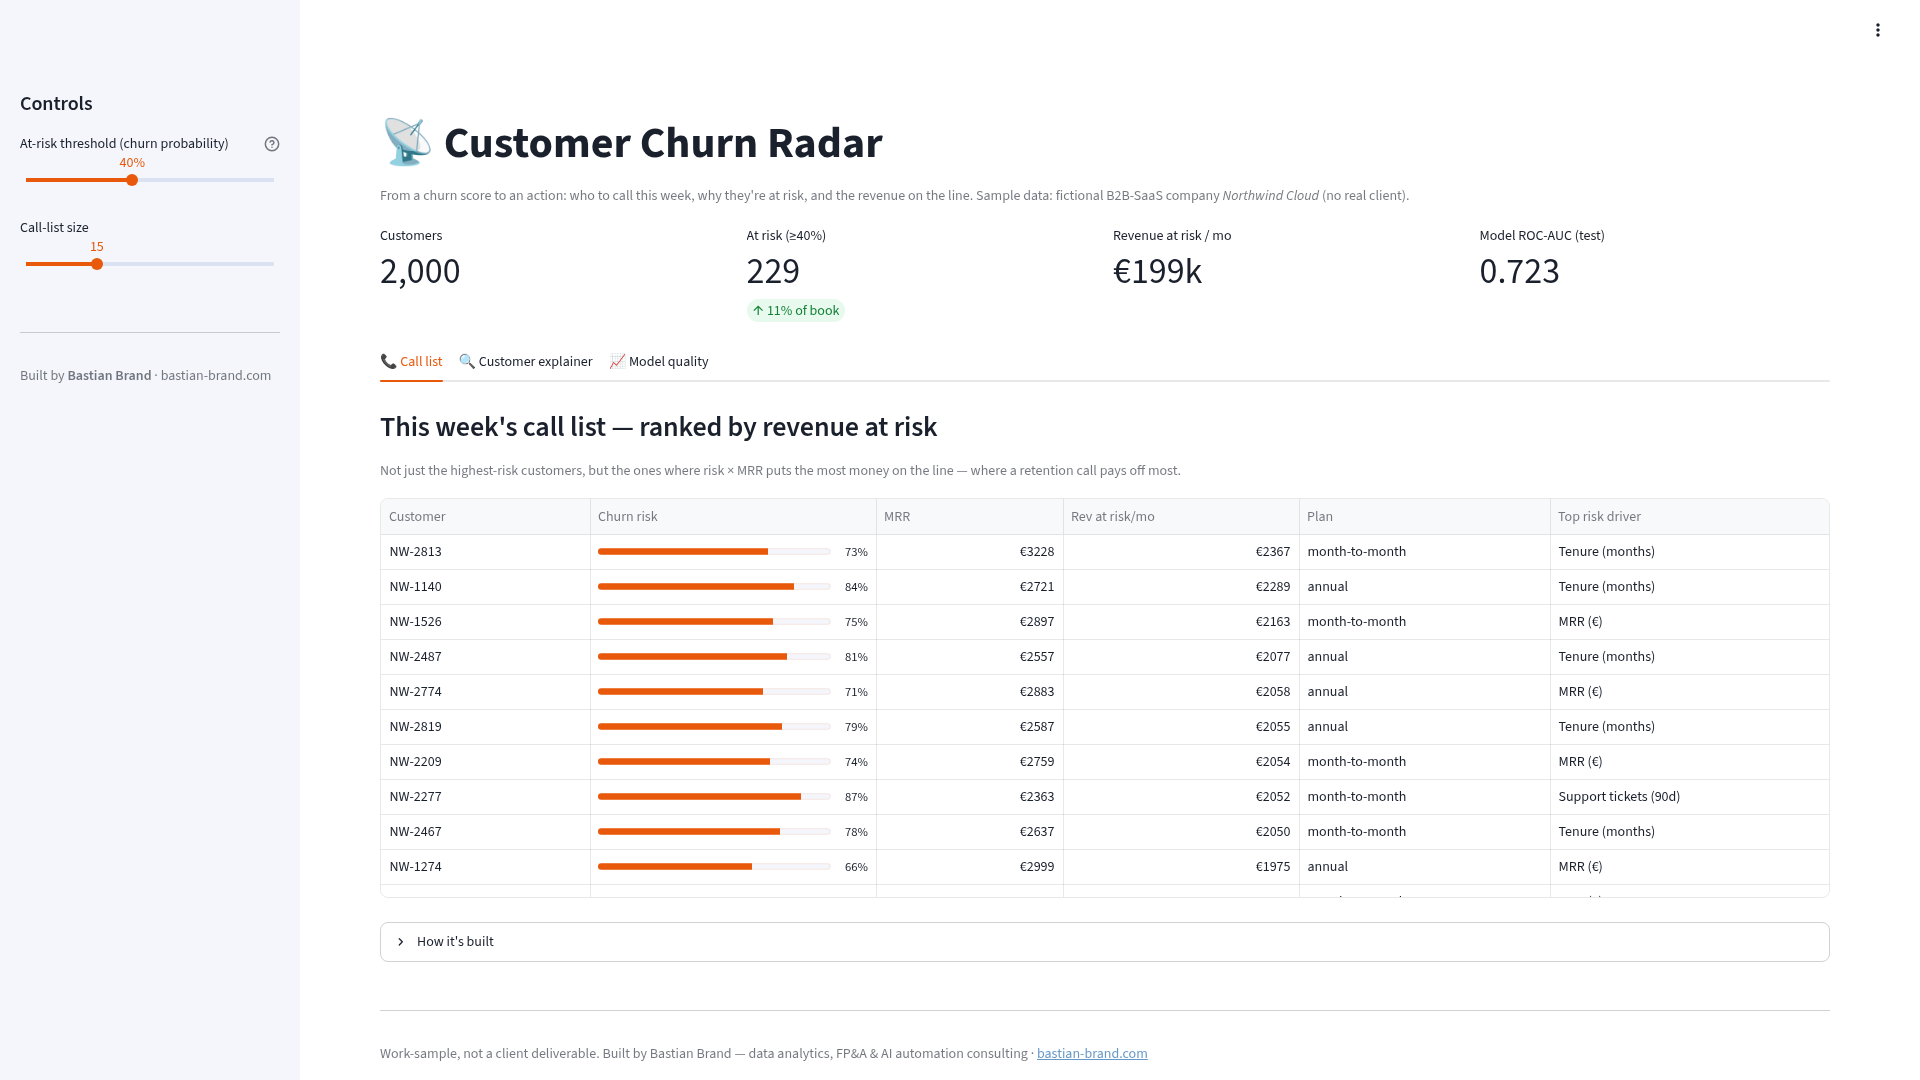
A churn-prediction tool that turns a score into an action. Most churn models hand you a black-box probability; the value is in the why and the so-what. This one trains on historical customers, scores the whole book, and produces this week’s call list — ranked not by raw risk but by revenue at risk (risk × MRR), because that is where a retention call actually pays off. For any customer, it explains why they’re at risk, driver by driver.
Runs on sample data for a fictional B2B-SaaS company (no real client).
How I built it
A gradient-boosting classifier (scikit-learn) is trained on 70% of customers and evaluated on a held-out 30% — the reported ROC-AUC is the honest test score, not an in-sample number. Every prediction is explained with SHAP: exact, additive contributions to the model’s log-odds, so each “why” is auditable rather than a heuristic. That’s the difference between “this customer scores 0.87” and “call them — they’re month-to-month, their usage is falling, and they’ve filed nine tickets this quarter.” A cumulative-gains view shows how targeting the riskiest first concentrates the retention effort.
Highlights
- Ranks by revenue at risk, not raw probability — the metric a Head of CS optimises
- SHAP per-customer explanations: auditable reasons, not a black box
- Honest evaluation (held-out ROC-AUC, cumulative-gains curve)
Stack
Python · scikit-learn · SHAP · Streamlit · Plotly