Revenue Forecast & Scenario Planner
Data & Processes • Work sample
Live: forecast.bastian-brand.com
What it is
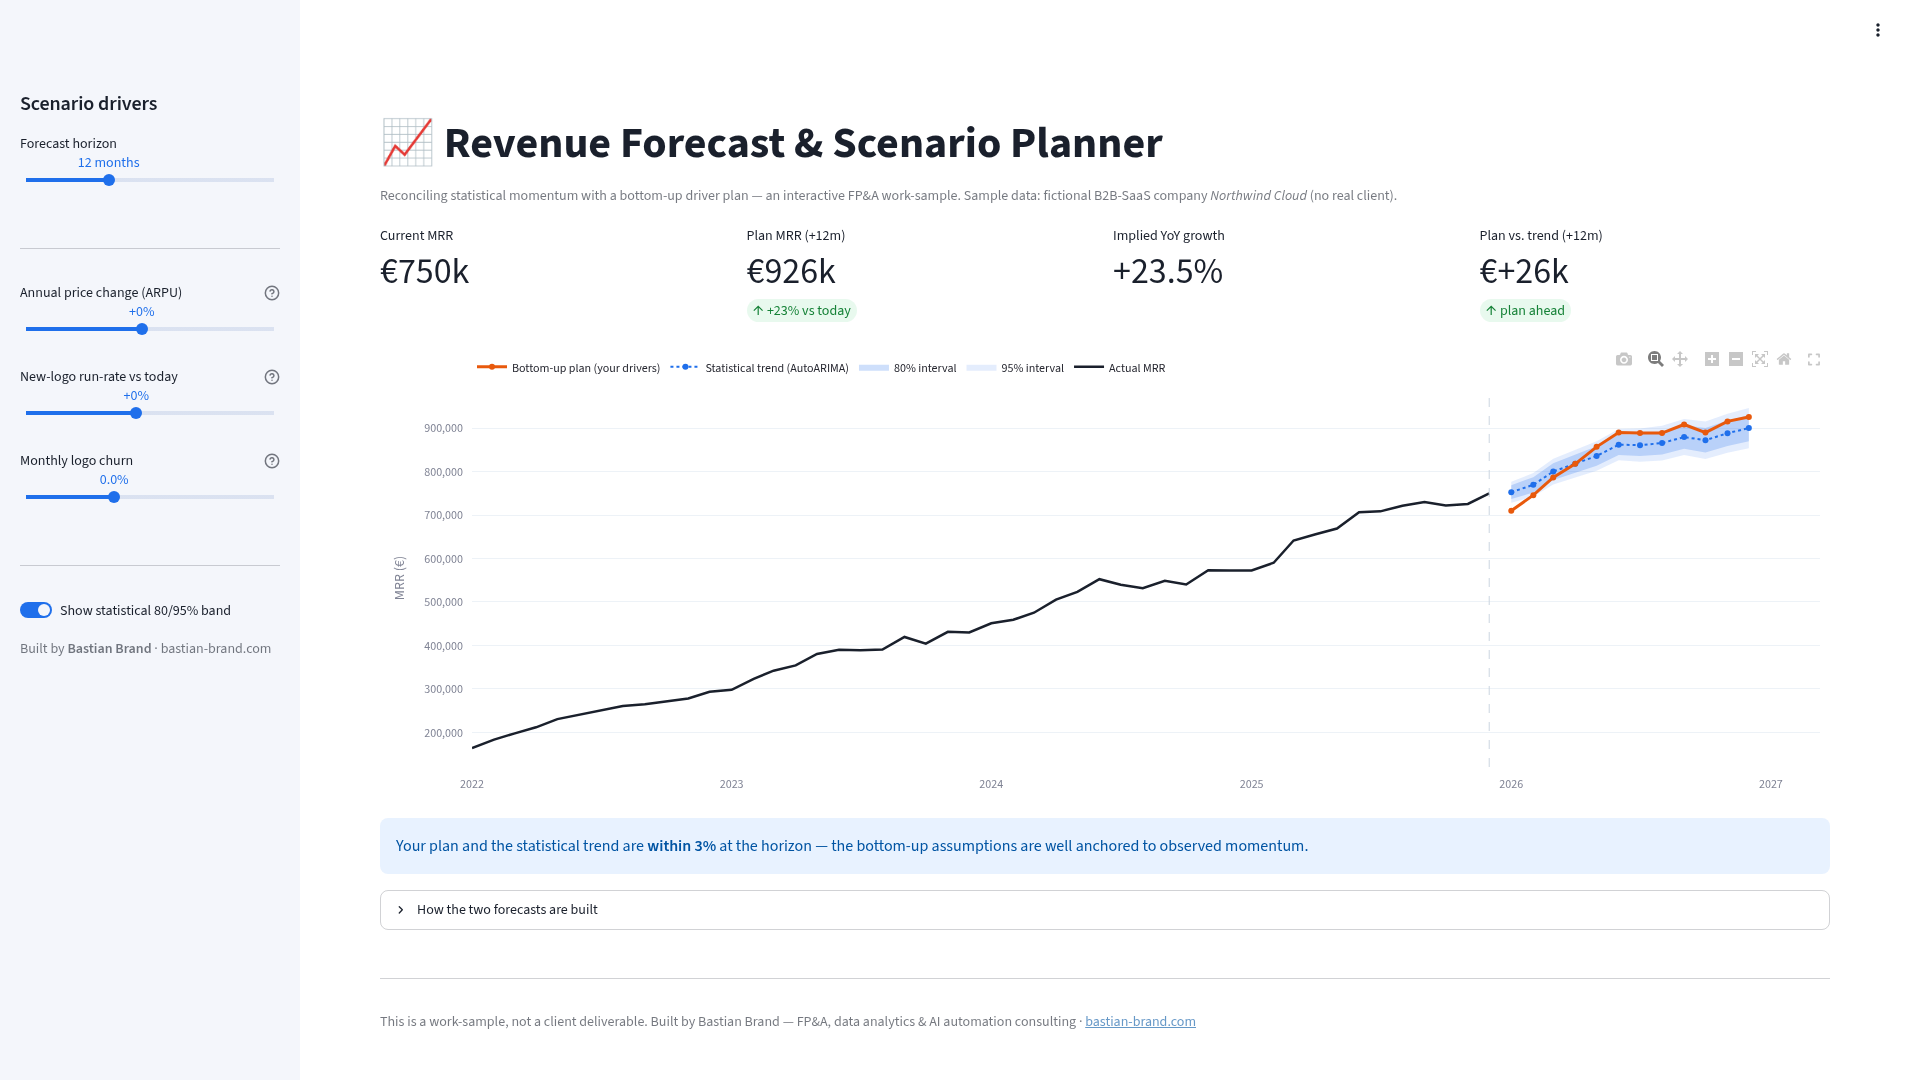
An interactive FP&A tool that reconciles the two ways a finance team projects revenue: the statistical momentum of the business, and the bottom-up plan the leadership team assumes. You move three levers — annual price change, new-customer run-rate, monthly churn — and watch a driver-based plan re-draw itself on top of a statistical forecast band. The headline is the gap between the two: it turns “the plan says €X” into “the plan is N% ahead of trend, and here is the driver responsible” — the actual conversation an FP&A partner has with a CFO.
Runs on sample data for a fictional B2B-SaaS company (no real client).
How I built it
The statistical forecast is an AutoARIMA model (seasonal, 12-month period) fitted on the revenue history; it selects its own ARIMA orders by AICc and produces a point forecast with 80% / 95% prediction intervals — a technique I first applied hands-on during my data-analytics training. The bottom-up scenario is a transparent driver model: customers roll forward as retained + new logos, ARPU compounds from the price lever, and revenue is customers × ARPU × seasonal_index, with the seasonal index derived from the history itself. Everything recomputes instantly as you drag a slider; the heavier model fit is cached so interaction stays snappy.
Highlights
- Two forecasting philosophies (time-series vs. driver-based) reconciled in one view
- Honest uncertainty: real prediction intervals, not a single deceptive line
- Instant what-if: every lever is a live driver, not a static chart
Stack
Python · Streamlit · statsforecast (AutoARIMA) · Plotly · pandas / NumPy