datalab
Data & Processes • Own ML/MLOps platform
What it is
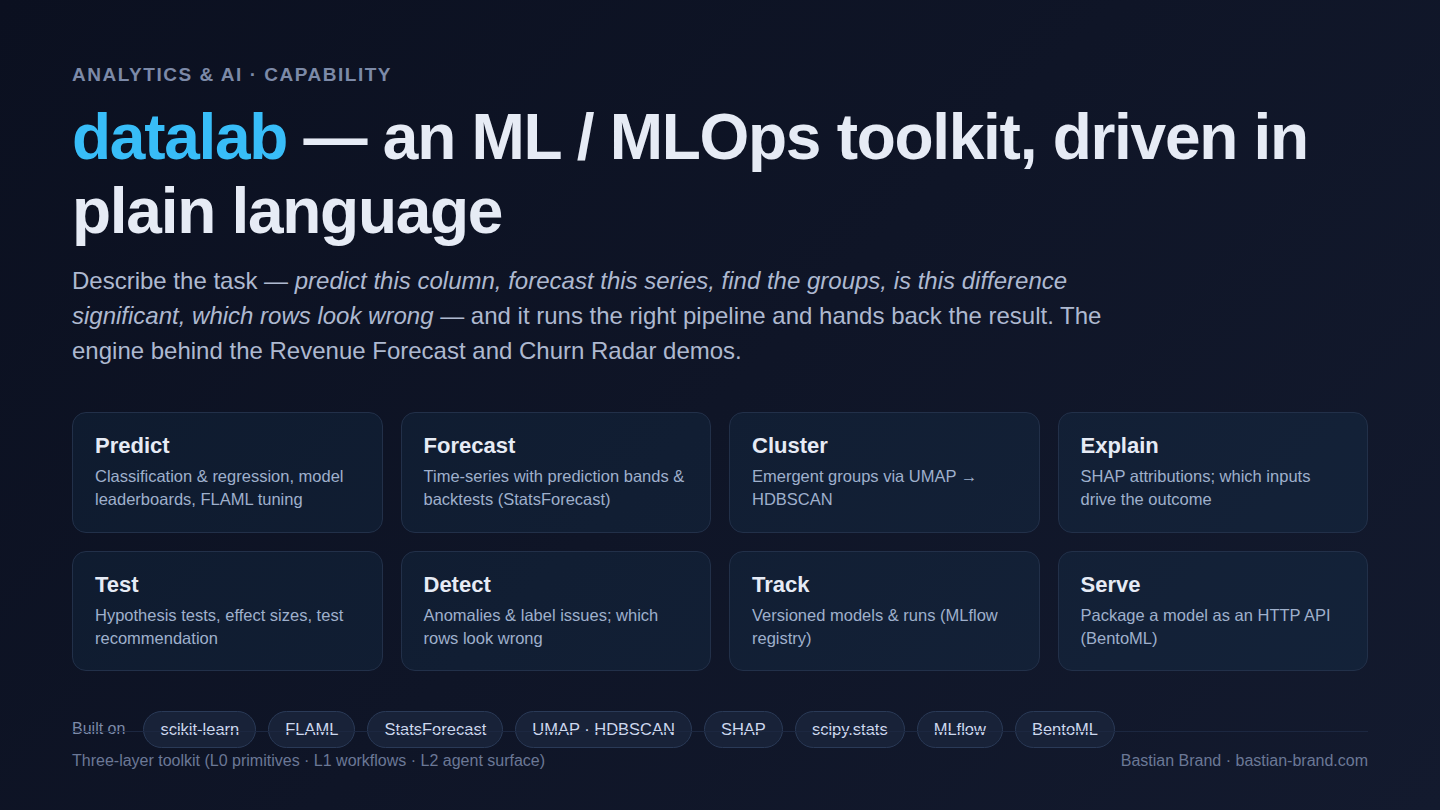
The toolkit behind the other analytics demos on this site. Rather than a one-off model, it’s a reusable ML/MLOps layer you drive in plain language: describe the task — predict this column, forecast this series, find the groups, is this difference significant, which rows look wrong — and it picks and runs the right pipeline, then hands back a result you can act on. The Revenue Forecast and Customer Churn Radar demos are built on its forecasting and classification/SHAP lanes.
How I built it
A three-layer design: low-level primitives (L0) wrapped into task workflows (L1), exposed through a single agent-facing surface (L2). Under the hood it composes the right tools for the job — scikit-learn and FLAML for supervised learning and tuning, StatsForecast for time-series with prediction bands, UMAP + HDBSCAN for unsupervised structure, SHAP for explanations, scipy.stats for inference — and treats models as first-class artifacts: every run is tracked and versioned in MLflow, and any model can be packaged as an HTTP API with BentoML. The point is repeatability: the same toolkit produces the forecast, the churn model and its explanations, so the analysis is reproducible rather than bespoke each time.
Highlights
- One toolkit, many tasks — predict, forecast, cluster, explain, test, detect, serve
- Models as versioned artifacts (MLflow registry), servable on demand (BentoML)
- The reusable engine under the other demos, not a throwaway notebook
Stack
Python · scikit-learn · FLAML · StatsForecast · UMAP/HDBSCAN · SHAP · MLflow · BentoML